non parametric and parametric linear and nonlinear regression
to run this m file type 'nppregression(sigma)' in the matlab command line, where 'sigma' is parameter of the gauss window function
Contents
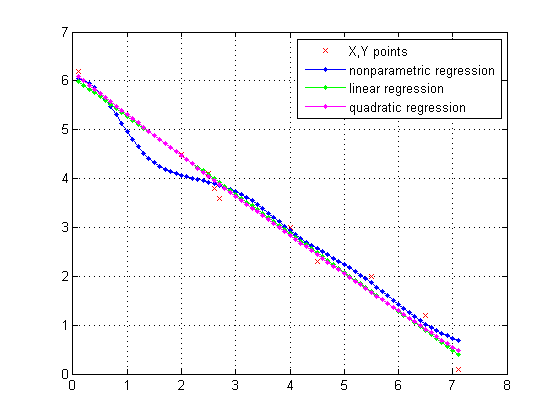
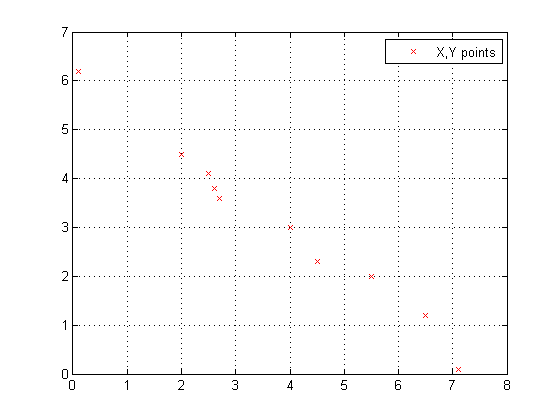
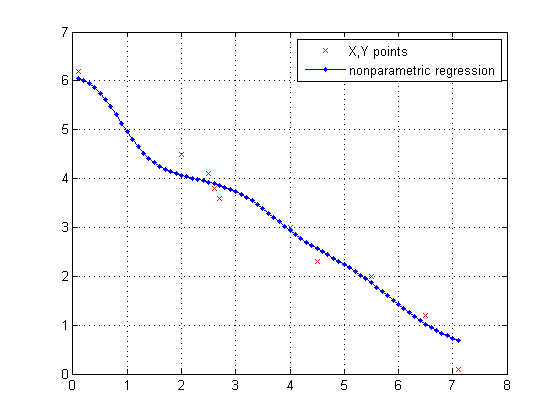
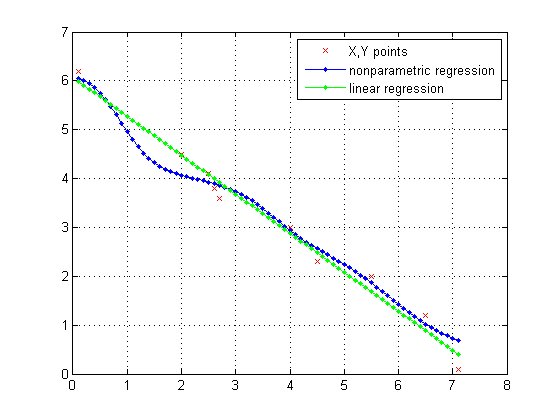
 %function nppregression(sigma) % For HTML demo, function is omitted
sigma=0.8;                      % For HTML demo, value of 0.8 is chosen.
close all;
% vrednosti enako spremenljivk X in Y
X=[2.0,6.5,4.5,2.7,0.1,5.5,4.0,7.1,2.5,2.6];
Y=[4.5,1.2,2.3,3.6,6.2,2.0,3.0,0.1,4.1,3.8];
% dimension of X
n=size(X);
% plot of points (X,Y)
plot(X,Y,'xr');
hold on
grid on
legend({'X,Y points'})
press "enter" to continue
pause;
z = [];
calculation of nonparametric regression Yc=y1/y2 for xmin to xmax with step 0.1
for t=min(X):0.1:max(X)
    y1=0;
    y2=0;
    for i=1:n(2)
     y1=y1+Y(i)*wgauss(t,X(i),sigma);
     y2=y2+wgauss(t,X(i),sigma);
    end
  y=y1/y2;
  z = [z; [t y]];
end
plot of Yc
plot(z(:,1),z(:,2),'b.-')
legend({'X,Y points';'nonparametric regression'})
hold on
linear regression
pause;
 x=X';
p=polyfit(X,Y,1)
t=min(X):0.1:max(X);
ylr=p(1)*t+p(2);
plot(t,ylr,'g.-')
hold on
legend({'X,Y points';'nonparametric regression';'linear regression'})
p =

   -0.7975    6.0707
quadratic regression
pause;
 x=X';
p=polyfit(X,Y,2)
t=min(X):0.1:max(X);
ylr=p(1)*t.^2+p(2)*t+p(3);
plot(t,ylr,'m.-')
hold on

legend({'X,Y points';'nonparametric regression';'linear regression';'quadratic regression'})
p =

    0.0103   -0.8760    6.1763