Calculate and plot slope field dx/dt of a 1D system "integrate1D"
Contents
- Definition of the variables range t, x and mesh grid to points (tx, xx) to calculate the slope field
- Calculation of the slope field
- Plot the slope field (dt,dx) in the points tx, xx
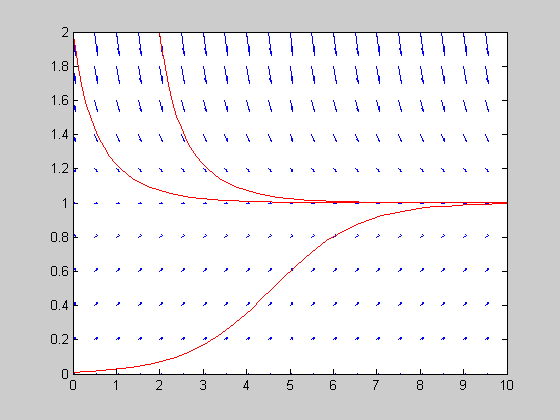
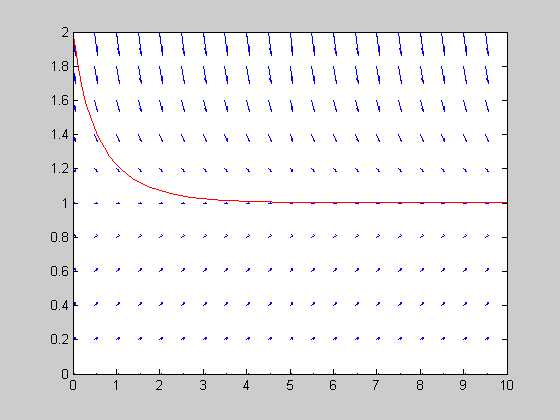
- Integrate and plot the trajectory into the slope field t=0, x=2
- Integrate and plot the trajectory into the slope field t=0, x=0.01
- plot the trajectory into the slope field t=2, x=2
close figures and clears the memory
close all, clear
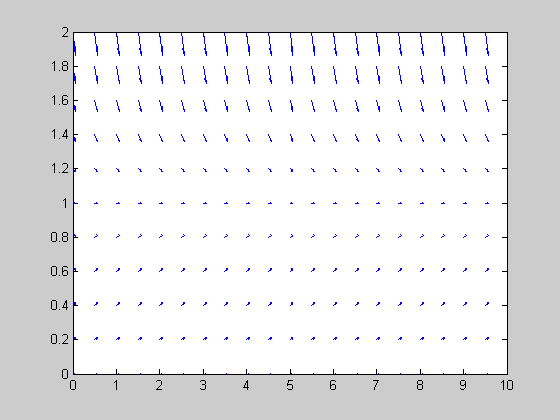
Definition of the variables range t, x and mesh grid to points (tx, xx) to calculate the slope field
%upper integration time limit
tk=10;
t = 0:.5:tk;
x = 0:.2:2;
% Definition of the rectangular mesh grid for t, x
[tx,xx] = meshgrid(t,x);
Calculation of the slope field
Awkward definition of dt used in calculation of dx
dt=1;
% calculation of the dx/dt given by the equation
dxdt=xx.*(1-xx);
% calculation of coresponding dx and dt
dx=dxdt*dt;
td=ones(length(x),length(t)) * dt;
Plot the slope field (dt,dx) in the points tx, xx
quiver(tx,xx,td,dx,0.3);
% fixing the figure
axis([0 tk 0 2]);
hold;
Current plot held
Integrate and plot the trajectory into the slope field t=0, x=2
initial value t=0, x=2
[t,y]=ode45(@integrate1D,[0 tk],[2]);
plot(t,y(:,1),'r');
Integrate and plot the trajectory into the slope field t=0, x=0.01
%initial value t=0, x=0.1
[t,y]=ode45(@integrate1D,[0 tk],[0.01]);
plot(t,y(:,1),'r');
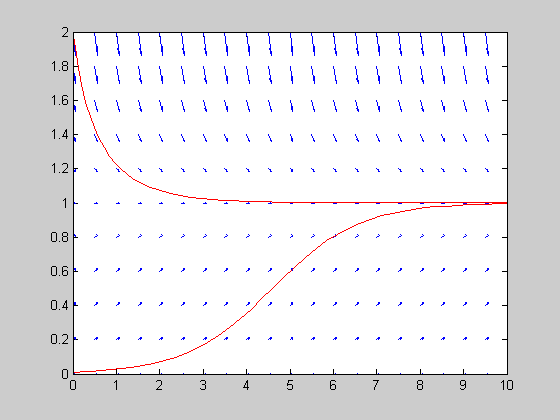
plot the trajectory into the slope field t=2, x=2
%initial value t=2, x=2
[t,y]=ode45(@integrate1D,[0 tk],[2]);
plot(t+2,y(:,1),'r');