Exploring Lorenz Parameters space
Contents
- origin stable node (0 < r < 1)
- origin unstable (saddle point) - two additional stable fixed points C+ and C- (1 < r < rH=24.74)
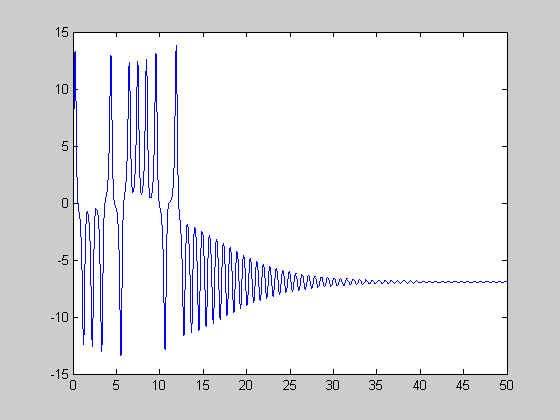
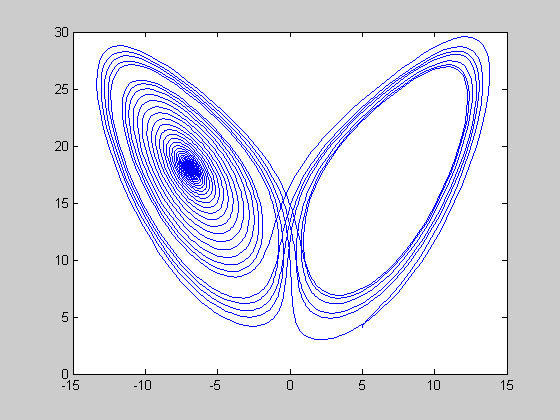
- transient chaos (13.9 < r < 24.06)
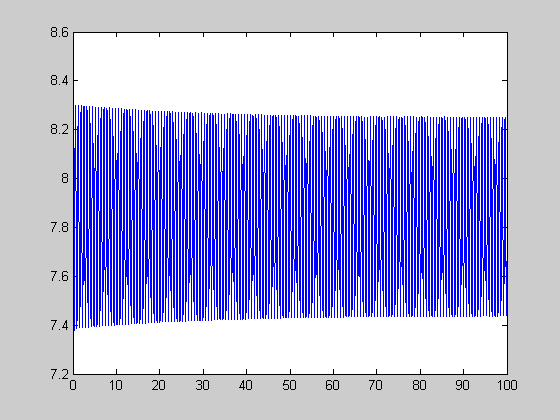
- coexistence of fixed point and chaotic attractor (24.06 < r < rH=24.74)
- chaos poure (rH=24.74 < r < 28)
- periodic windows in (28 < r < 313)
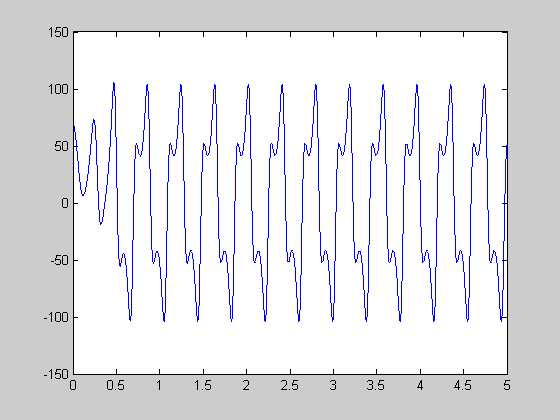
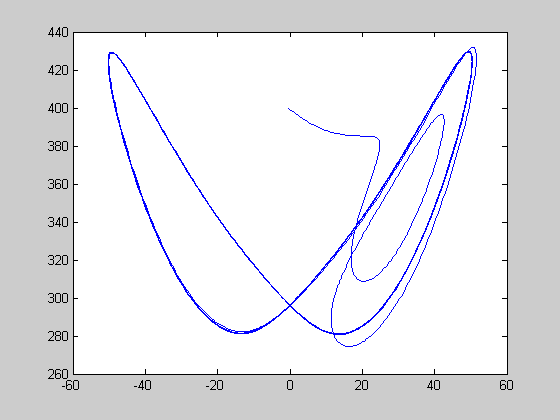
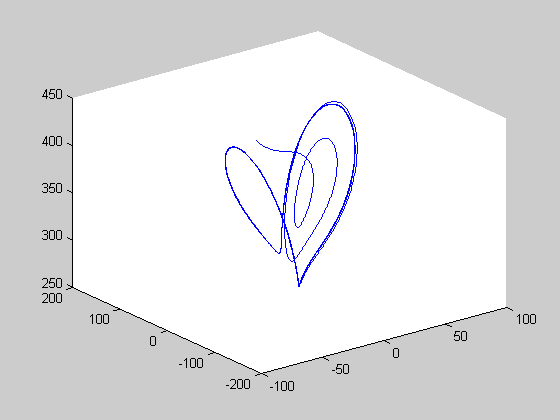
- periodic solution at r=350
close all; clear;
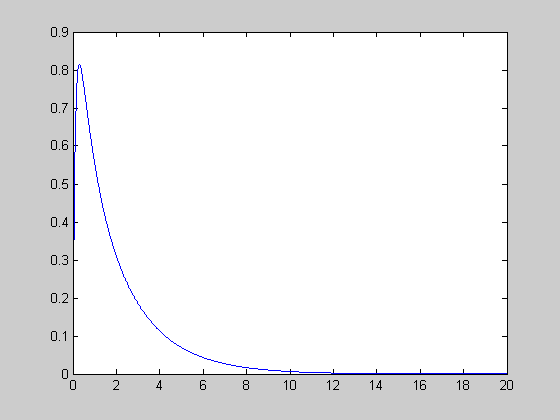
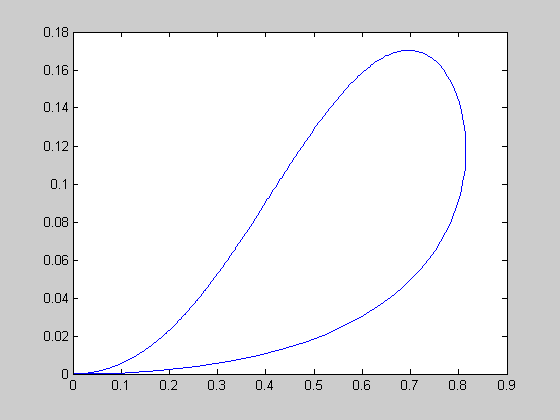
origin stable node (0 < r < 1)
check initial conditions [0.0 1.0 1.0], [0.0 1.0 -1.0]
r=0.5;
[t,y]=ode45(@lorenz,[0:0.01:20],[0.0 1.0 0.0],[],r);
figure(1);
plot(t,y(:,1));
figure(2);
plot(y(:,1),y(:,3));
origin unstable (saddle point) - two additional stable fixed points C+ and C- (1 < r < rH=24.74)
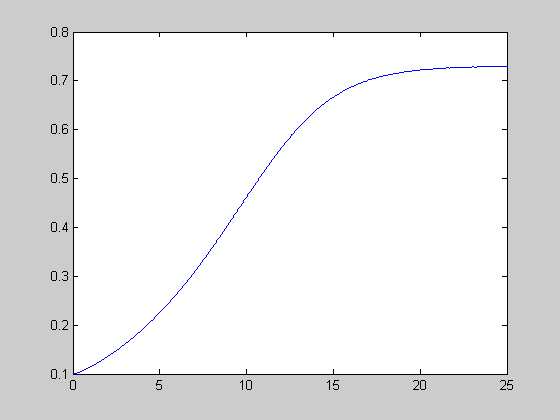
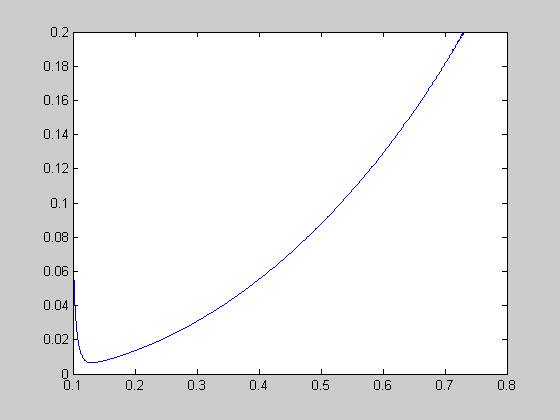
C+ and C- stable nodes (1 < r < 1.346)
r=1.2;
[t,y]=ode45(@lorenz,[0:0.01:25],[0.1 0.1 0.1],[],r);
figure(1);
plot(t,y(:,1));
figure(2);
plot(y(:,1),y(:,3));
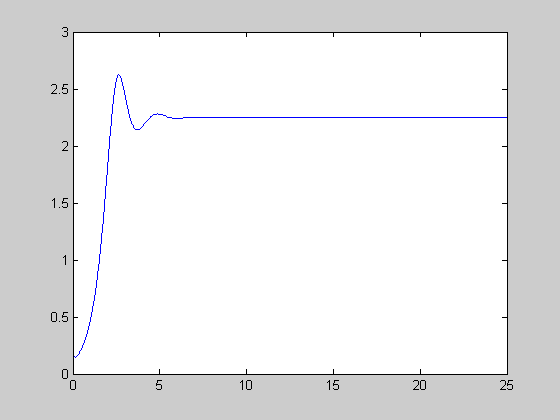
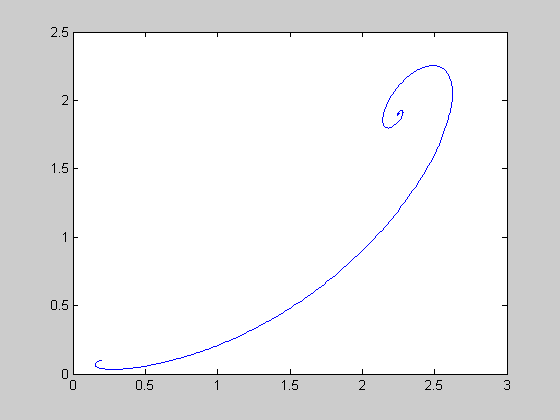
C+ and C- stable spirals (1.346 < r < 13.926) initial [-0.4 0.1 0.1],[-0.41 0.1 0.1]
r=2.9;
[t,y]=ode45(@lorenz,[0:0.01:25],[0.2 0.1 0.1],[],r);
figure(1);
plot(t,y(:,1));
figure(2);
plot(y(:,1),y(:,3));
transient chaos (13.9 < r < 24.06)
initial [5 5 4.1], [5 5 4.11]
r=19;
[t,y]=ode45(@lorenz,[0:0.01:50],[5 5 4.1],[],r);
figure(1)
plot(t,y(:,1));
figure(2)
plot(y(:,1),y(:,3));
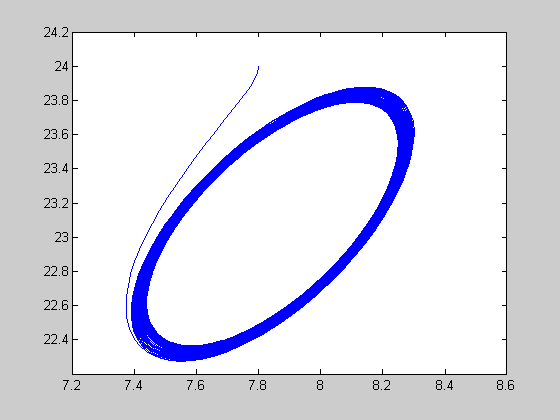
coexistence of fixed point and chaotic attractor (24.06 < r < rH=24.74)
close to fixed point
r=24.08;
[t,y]=ode45(@lorenz,[0:0.01:100],[7.8 7.8 24],[],r);
figure(1)
plot(t,y(:,1));
figure(2)
plot(y(:,1),y(:,3));
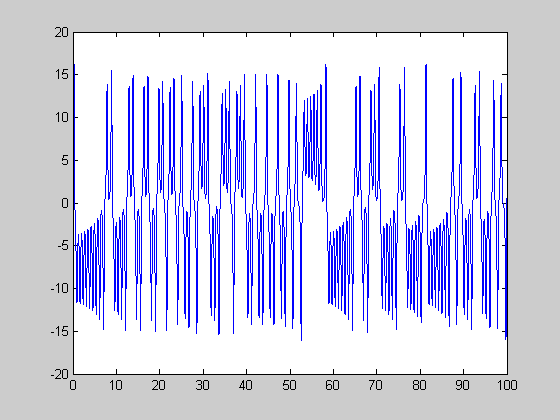
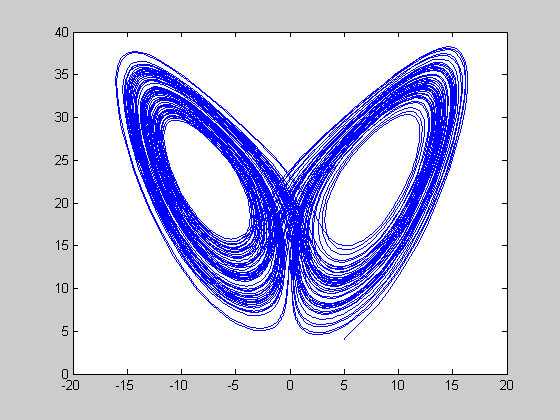
chaos
r=24.08;
[t,y]=ode45(@lorenz,[0:0.01:100],[5 5 4],[],r);
figure(1)
plot(t,y(:,1));
figure(2)
plot(y(:,1),y(:,3));
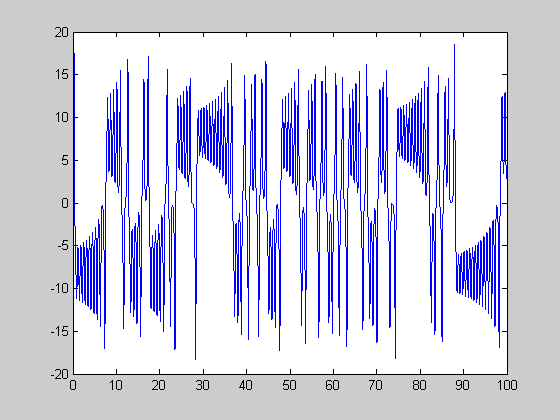
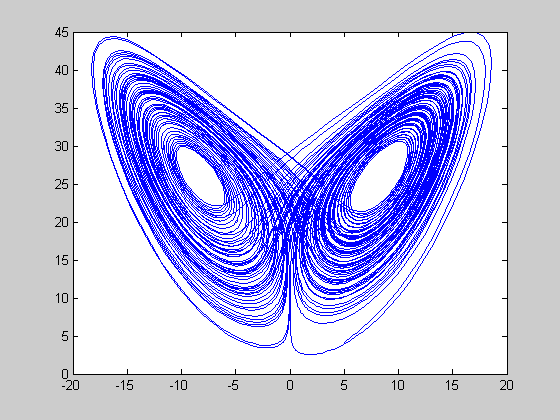
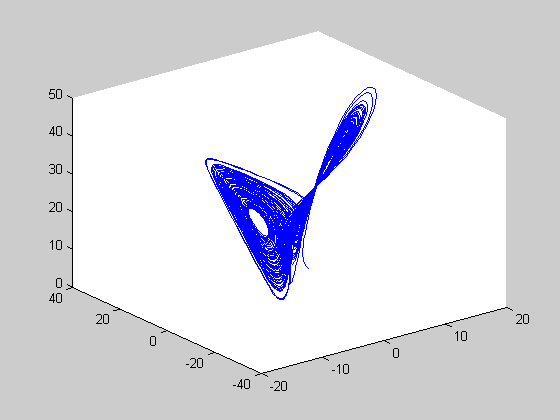
chaos poure (rH=24.74 < r < 28)
r=27;
[t,y]=ode45(@lorenz,[0:0.01:100],[5 5 4],[],r);
figure(1)
plot(t,y(:,1));
figure(2)
plot(y(:,1),y(:,3));
figure(3)
plot3(y(:,1),y(:,2),y(:,3));
periodic windows in (28 < r < 313)
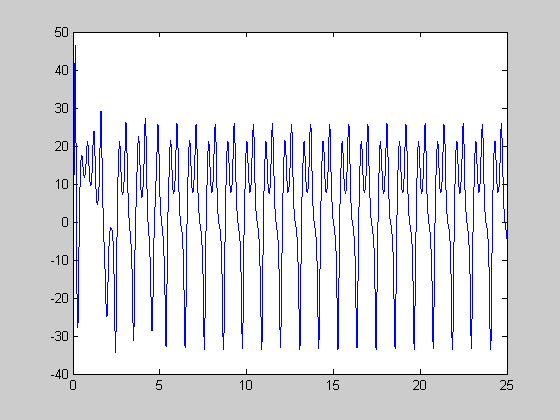
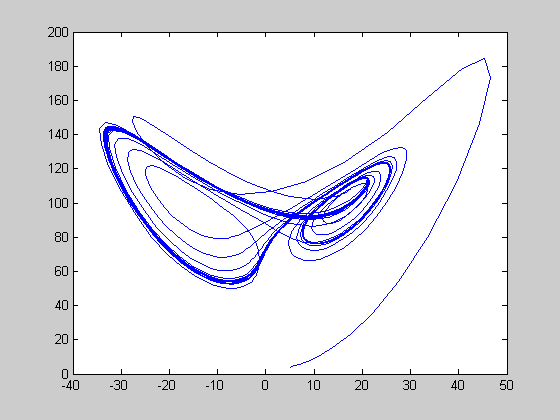
99.524..< r 100.795...
r=100.0;
[t,y]=ode45(@lorenz,[0:0.01:25],[5 5 4],[],r);
figure(1)
plot(t,y(:,1));
figure(2)
plot(y(:,1),y(:,3));
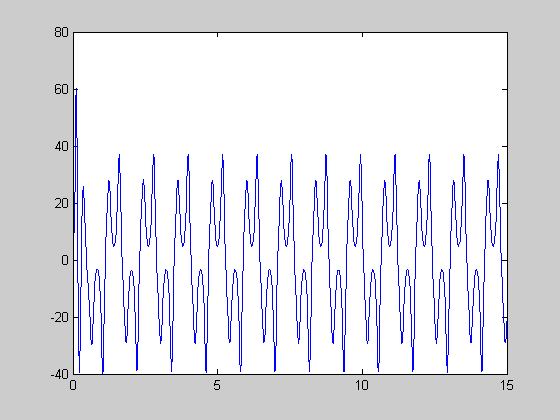
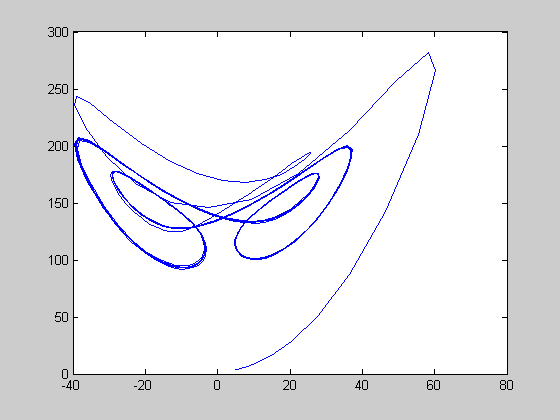
145 < r < 166
r=150.0;
[t,y]=ode45(@lorenz,[0:0.01:15],[5 5 4],[],r);
figure(1)
plot(t,y(:,1));
figure(2)
plot(y(:,1),y(:,3));
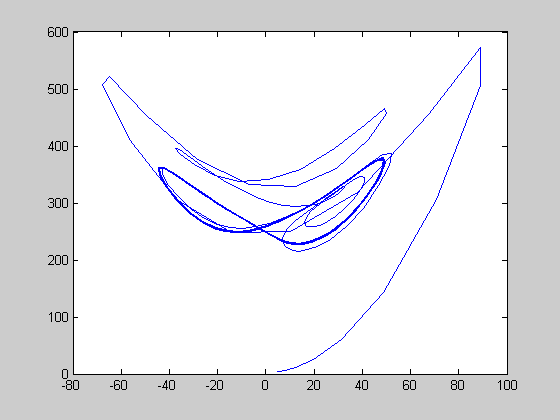
214.4 < r < 313
r=300.0;
[t,y]=ode45(@lorenz,[0:0.01:15],[5 5 4],[],r);
figure(1)
plot(t,y(:,1));
plot(y(:,1),y(:,3));
figure(2)
periodic solution at r=350
313 < r
[5 5 400], [-5 5 400], [-5 5 450]
r=350.0;
[t,y]=ode45(@lorenz,[0:0.001:5],[-0.5 70 400],[],r);
figure(1)
plot(t,y(:,2));
figure(2)
plot(y(:,1),y(:,3));
figure(3);
plot3(y(:,1),y(:,2),y(:,3));
