Limit Cycle Example - Plot stabilty diagram and phase portait for dynamics of Glycolisis
Contents
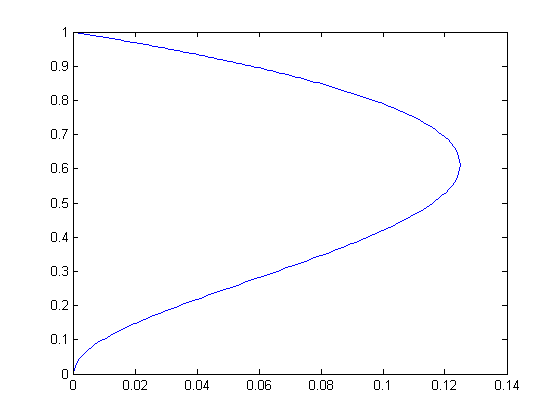
Calculate and plot stabilty diagram
a=0:0.001:0.125;
bm=0.5*(1-2*a-sqrt(1-8*a));
bp=0.5*(1-2*a+sqrt(1-8*a));
plot(a,sqrt(bm));
hold;
plot(a,sqrt(bp));
Current plot held
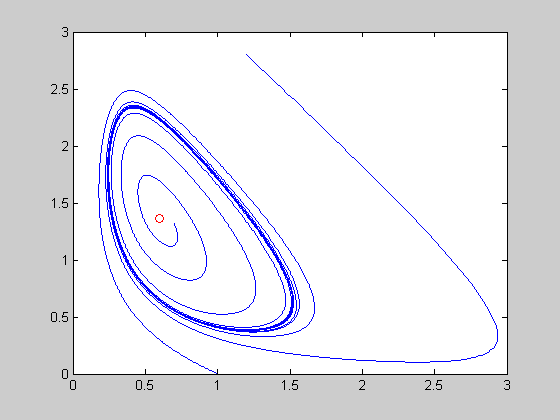
Calculate and plot different phase space trajectories for parameter a=0.08 and b=0.6
a(1)=0.08;
a(2)=0.6;
[t,y]=ode45(@glycol,[0:0.01:50],[1 0],[],a);
figure(2);
plot(y(:,1),y(:,2));
hold;
[t,y]=ode45(@glycol,[0:0.01:50],[0.7 1.32],[],a);
figure(2);
plot(y(:,1),y(:,2));
[t,y]=ode45(@glycol,[0:0.01:50],[1.2 2.8],[],a);
figure(2);
plot(y(:,1),y(:,2));
xf=a(2);
yf=a(2)/(a(1)+a(2).^2);
figure(2);
plot(xf,yf,'or');
Current plot held
dyamical system - glycol.m file