Calculate and plot a 2D-vector field and trajectories for a nonlinear saddel point
Contents
close figures and clears the memory
close all, clear
% parameter value
p=1;
% define range of the variabels x and y
x = -2:.2:2;
y = -1:.2:1;
% axis([min(x) max(x) min(y) max(y)]);
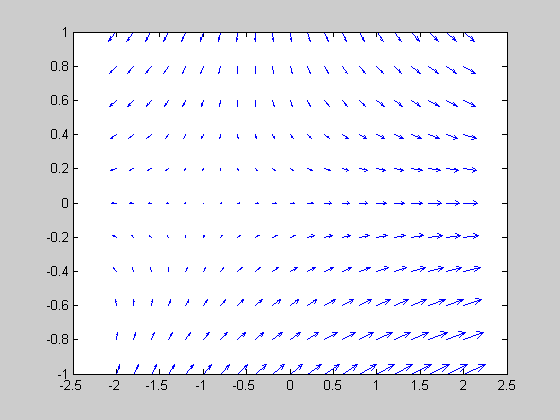
Defining mesh of points and calculation of vector vield
mesh
[xx,yy] = meshgrid(x,y);
% Vector field calculation in x and y direction
xd= xx+exp(-yy);
yd= -yy;
% Drawing the vector field
quiver(xx,yy,xd,yd,1);
hold;
Current plot held
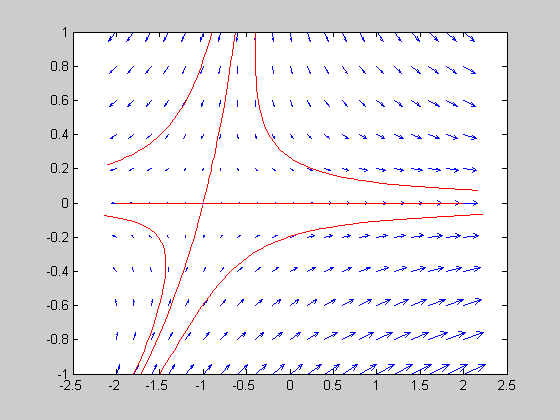
Calculates and plot saddel point phase portrait
[t,y]=ode45(@D2vf,[0 -4.6],[-1 0.01]);
plot(y(:,1),y(:,2),'r');
[t,y]=ode45(@D2vf,[0 -4.6],[-1 -0.01]);
plot(y(:,1),y(:,2),'r');
[t,y]=ode45(@D2vf,[0 2.6],[-0.4 1]);
plot(y(:,1),y(:,2),'r');
[t,y]=ode45(@D2vf,[0 1.5],[-0.9 1]);
plot(y(:,1),y(:,2),'r');
[t,y]=ode45(@D2vf,[0 2.6],[-1.8 -1]);
plot(y(:,1),y(:,2),'r');
[t,y]=ode45(@D2vf,[0 2.7],[-1.5 -1]);
plot(y(:,1),y(:,2),'r');
[t,y]=ode45(@D2vf,[0 4.6],[-1.01 0]);
plot(y(:,1),y(:,2),'r');
[t,y]=ode45(@D2vf,[0 5.7],[-0.99 0]);
plot(y(:,1),y(:,2),'r');
Code for D2vf.m file
function dx=D2vf(t,x) dx=zeros(2,1); dx(1)=x(1)+exp(-x(2)); dx(2)=-x(2);